
In many ways, you can treat Microsoft Power BI as the next generation of Excel. And like Excel, it’s not just useful for business analysts and data engineers; IT pros can take advantage of it for understanding large amounts of data. If the security tools you use don’t have the right dashboards and reports to help you see at a glance what’s going on with your systems, you can build them yourself in Power BI — and you don’t need to be an expert in analytics to create something useful.
For example, you can use Microsoft Power BI to bring together data from the many security tools most organizations use, so you can see what’s happening across all the different systems attackers will be probing — email, identity, endpoints, applications and more — and spot the different stages of an attack.
SEE: Download our Microsoft 365 cheat sheet.
Custom security dashboards
The advantage of Power BI is how easy it is to create exactly the right reports and visualizations for what’s important to you, along with AI-powered analytics that find and highlight anomalies and outliers in the data. With a never-ending to-do list, security teams are always busy and always looking for ways to prioritize the most important issue they should be working on.

Subscribe to the Microsoft Weekly Newsletter
Be your company's Microsoft insider by reading these Windows and Office tips, tricks, and cheat sheets.
Delivered Mondays and Wednesdays“With very little training, we have seen folks creating detailed and interactive reports that really help with compliance, audit and security reporting,” Amir Netz, technical fellow and chief technology officer for Microsoft Fabric, told TechRepublic.
You can make mobile versions of your reports, so they’re easy to check if there’s an incident outside of hours that you need to assess quickly.
Make a Windows security update dashboard
There are Power BI content packs for various security tools, and several of Microsoft’s security tools have APIs, so you can bring that information into Power BI to visualize. Microsoft Defender for Endpoint has APIs to access threat and vulnerability data for software inventory, software vulnerabilities and devices that have been detected as being misconfigured — which includes missing Windows security updates (Figure A).
Figure A
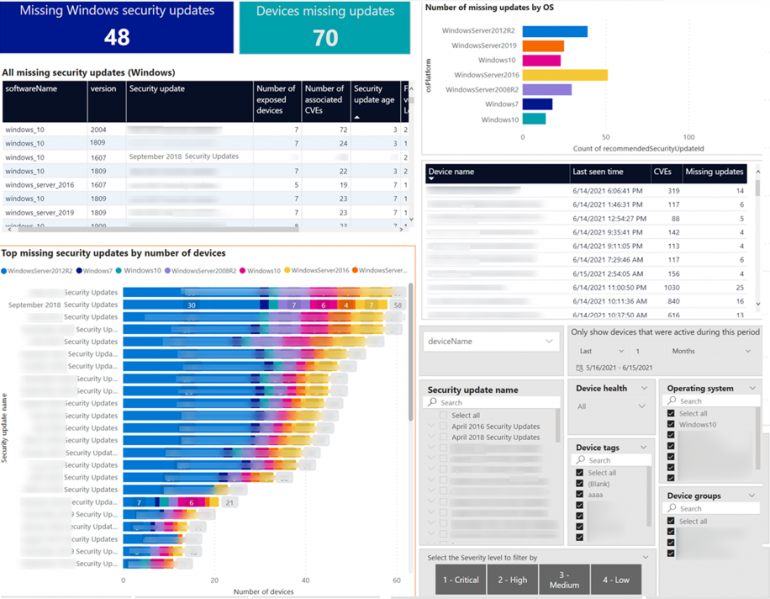
That way you can keep an eye on how many CVEs your organization is exposed to, see how much new software is being installed across your organization, get a priority list of exposed devices or look at what OS version vulnerable devices are running — whatever metrics and issues you need to have at your fingertips.
SEE: Take advantage of TechRepublic Premium’s Microsoft Power BI developer hiring kit.
Choose what to see on your dashboard
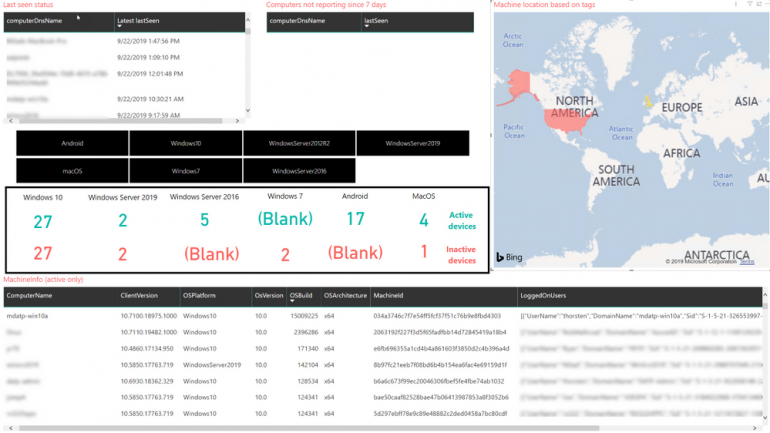
Netz suggests using the Treemap visual to quickly see the comparative numbers of devices and issues or even a simple bar chart that ranks various key measures.
“They show you relative magnitude of impact from a glance,” said Netz. “The Bing map visual can also be very effective in showing geo distribution of certain activities.”
You can add slicers to filter quickly to what you’re interested in, such as by operating system, and the visuals will update to show just that data (Figure B).
Figure B
Other ways you can customize your Power BI dashboard include:
- You might want a detailed report with a lot of visuals or just some key figures you can check quickly on your phone.
- The Microsoft Defender team runs a repository of useful Power BI Defender report templates that includes firewall, network, attack surface and threat management layouts.
- If you have a large numbers of devices, take the time to scope your queries to optimize them, so your Power BI reports don’t slow down because they’re pulling more data than you actually need.
- You can pull a full snapshot or only the changes since you last pulled the data, depending on whether you want to look back at security data over time to see patterns and see if security policies you’ve introduced are making a difference or whether you’re looking for the same kind of real-time overview that Power BI can give you for IoT devices.
- You can also connect to the Advanced Hunting APIs from Microsoft Defender 365 in the Microsoft Graph security API in a query in Power BI Desktop.
“Some customers are content with being in a more reactive position and examine daily/weekly snapshots, while others demand more real-time monitoring,” Netz said. Microsoft Power BI lets you pull together either kind of report quickly when you need it.
Monitor Power BI with Power BI
Because Microsoft Power BI can connect to almost any data source in your organization, you probably want to keep track of who is accessing data and visualizations and make sure it’s only the people you expect to have access to what might be critical or confidential business information.
The role-based access built into Microsoft Power BI will ensure only the right employees see information, as will Microsoft Purview Information Protection, as long as you’ve set up discovery, classification and sensitivity labels.
But, the Fabric administrator role lets admins keep track of who is looking at dashboards, reports and datasets without needing to be a global administrator. Monitoring user access permissions on Power BI workspace and artifacts means the IT department can feel sure users follow auditing and security requirements, Netz said.
You can do the same for any critical enterprise assets, thanks to Power BI’s integration with Microsoft Defender for Cloud Apps. With Defender for Cloud Apps, you can create conditional access policies that can be applied in real time by Microsoft Entra ID (the new name for Azure Active Directory). In the Defender for Cloud Apps portal you can set policies and get alerts that will let you:
- Stop users from copying and pasting data from a sensitive report.
- Look for people who are downgrading sensitivity levels on multiple documents.
- Look for people sharing a lot of reports or sharing a sensitive report with a new external email address they haven’t sent reports to before.
“Microsoft Defender for Cloud Apps enables organizations to monitor and control, in real time, risky Power BI sessions, such as user access from unmanaged devices,” said Netz. “Security administrators can define policies to control user actions, such as downloading reports with sensitive information. With Power BI’s integration, you can set monitoring policy and anomaly detection and augment Power BI user activity with the Activity log.”
That would help you find patterns like a malicious insider who uses Power BI data to find the critical business systems to exfiltrate data from with another tool.
“We provide raw audit log data that goes back 30 days via API and via the Microsoft 365 compliance center,” Netz said.
That way, if you see something suspicious in one of your custom security dashboards, you can go back and see what else was going on at the same time.
Subscribe to the Microsoft Weekly Newsletter
Be your company's Microsoft insider by reading these Windows and Office tips, tricks, and cheat sheets.
Delivered Mondays and Wednesdays