
For the Microsoft Power BI report designer, importing Microsoft Excel data is a common task. Once in Power BI, you analyze and report on that data. Occasionally, you might need to export a Power BI dataset to Excel. Perhaps a colleague wants to further analyze the data, or you want to analyze it a bit more; the process of exporting to Excel can be easy or impossible depending on your status.
In this tutorial, I’ll show you several ways to export Microsoft Power BI datasets to the .xlsx Excel format. We’ll start with the easiest method and work through the more complex methods. The discussion will include instructions for the dataset’s owner and the end users, because the export experience will be different.
SEE: Explore TechRepublic Premium’s Microsoft Power BI Hiring Kit.
I’m using Microsoft Power BI via Microsoft Fabric on a Windows 11 64-bit system. You don’t need Microsoft Fabric; however, if you don’t have it, you might notice subtle differences in the interface.
Jump to:
- Who can export Power BI datasets?
- How to set export permissions in Power BI Desktop
- How to use Analyze in Excel
- How to copy a table in Power BI Desktop
- How to export data from a Power BI report
- How to export from a Power BI dashboard
- Exporting a Power BI dataset
Who can export Power BI datasets?
Power BI is an organizational tool, so you might think that anyone with a link to a dashboard can export the underlying dataset. But that won’t always be the case. By default, Power BI restricts exporting the underlying dataset to administrators and report designers. Unless the owner of the dataset applies specific permissions for exporting, viewers — also known as consumers and end users — can’t export data via a dashboard or report.
SEE: Here’s everything you need to know about using Microsoft Power BI with this bundle from TechRepublic Academy.
Report designers, who are the owners of the dataset, control how end users can export data by setting one of these permissions:
- End users can export summarized data.
- End users can export both summarized data and the underlying dataset.
- End users can’t export any data.
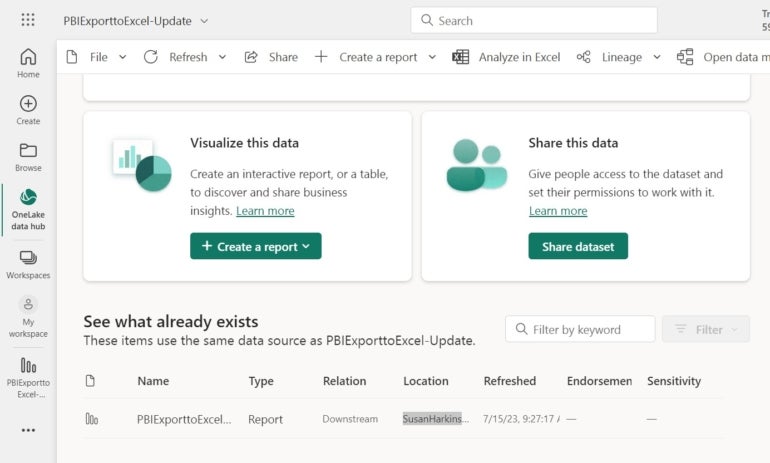
As an end user, if you can’t export the data, you can request the data by viewing the contact information under the report title (Figure A). To do so, click the LakeHouse data hub option, click the dataset file to open its details, and then copy the owner’s email address in the Location column. If you’re lucky, the owner has the data in an Excel .xlsx or .cvs file and can email or share it quickly. If you’re not using Fabric, look for the owner by clicking the report title in the report’s title bar.
Figure A
Designers can do themselves and consumers a favor by setting a report’s permissions to allow consumers to export the underlying data when they create a report, unless there are security reasons for not doing so.
How to set export permissions in Power BI Desktop
As the designer, you might want to allow exports. If so, you can set permissions in Power BI Desktop.
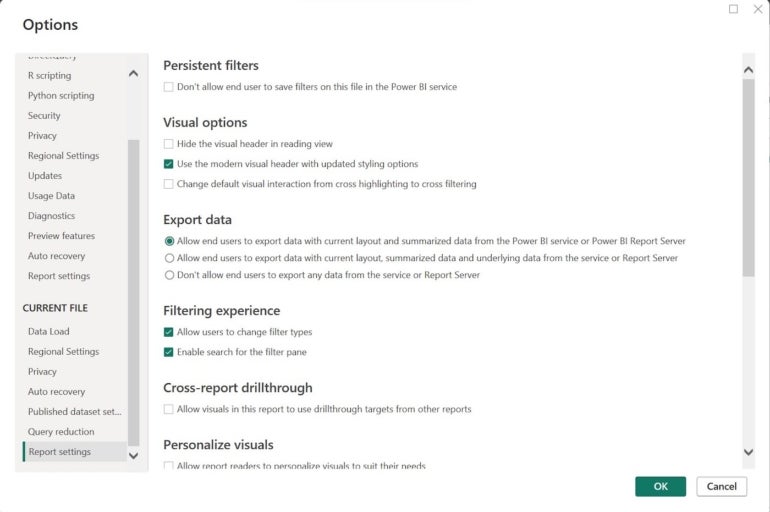
In design mode, click the File menu and choose Options and settings. In the resulting window, select Options. In the left pane, in the Current File section, select Report settings. To the right, select the appropriate export settings, and click OK (Figure B). As you can see, this report allows end users to download summarized data.
Figure B
How to use Analyze in Excel
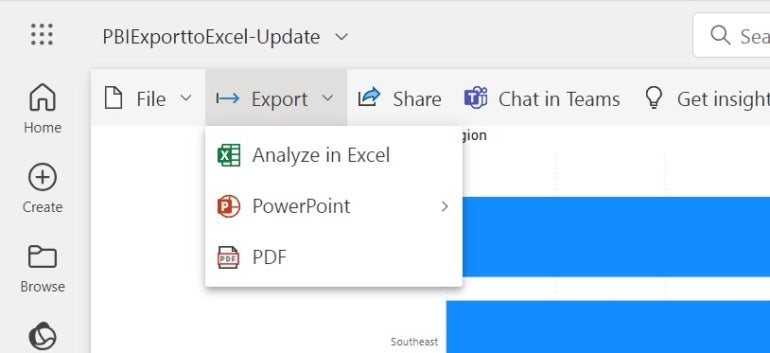
As a consumer, the quickest and easiest way to export the dataset to Excel is to use the Analyze in Excel feature. While viewing the report, click Export and choose Analyze in Excel from the dropdown (Figure C).
Figure C
This feature copies the dataset to Excel for the web for quick and easy access. From there, you can download the .xlsx file to your local system. That’s the good news. The bad news is the inherent structure of the exported data: This feature exports the summarized data, literally, as a PivotTable. You don’t get the raw dataset.
SEE: Explore these Excel tips everyone should master.
Depending on your organization’s configuration, Analyze in Excel may not even be available. If you’re after the data as a simple dataset rather than a PivotTable or this feature isn’t available, you can rely on other options.
How to copy a table in Power BI Desktop
If you own the report file and a consumer asks you for its dataset, but you don’t have the original .xlsx file, you can create one using Power BI Desktop. Simply open the report in Power BI Desktop. To the left are three icons. Click Data — the one in the middle — to see the dataset.
SEE: Learn how to create a date table in Power BI.
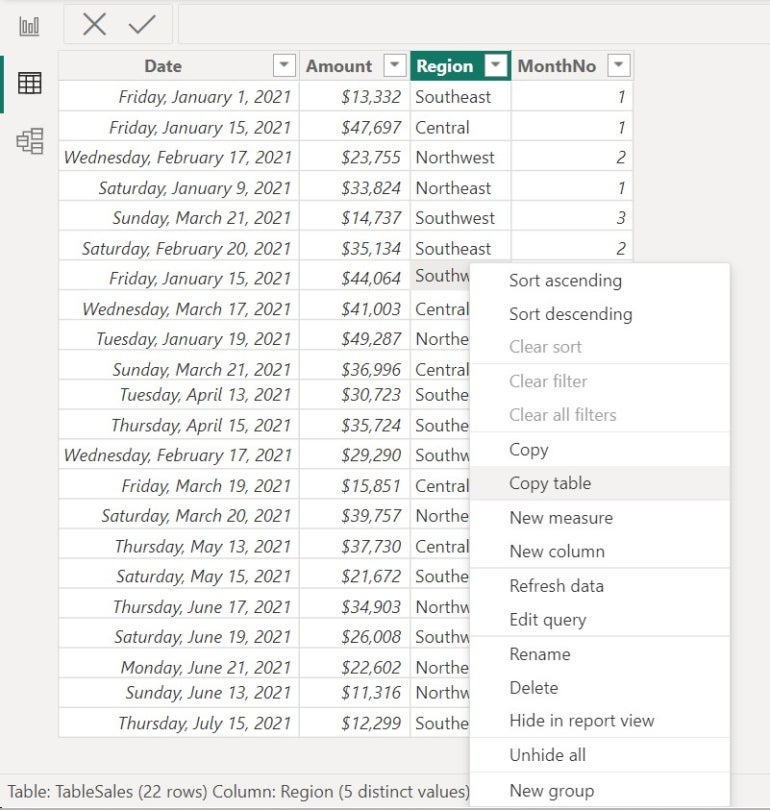
Right-click the table and choose Copy Table (Figure D). Doing so copies the dataset to the Clipboard. From there, open a blank Excel workbook and paste the dataset into a sheet. You can now send it off to your colleague.
Figure D
How to export data from a Power BI report
As a consumer, you’ll have to work a bit harder and export from a report; what you’ll get depends on the specific permissions set by the designer or Power BI’s default settings.
Figure E shows two visualizations based on a report. That report, in turn, is based on a dataset — it’s the dataset you’re after.
Figure E

If the owner set export permissions in Power BI Desktop when creating the report, you should be able to export the dataset. The process is simple, but keep in mind that it might not return the full dataset. To export as a consumer, do the following:
- Hover your mouse over the tile or visualization in question.
- You’ll see an ellipsis (…) in the upper-right corner. If you don’t, click above the visualization.
- From the ellipsis dropdown, choose Export data (Figure E).
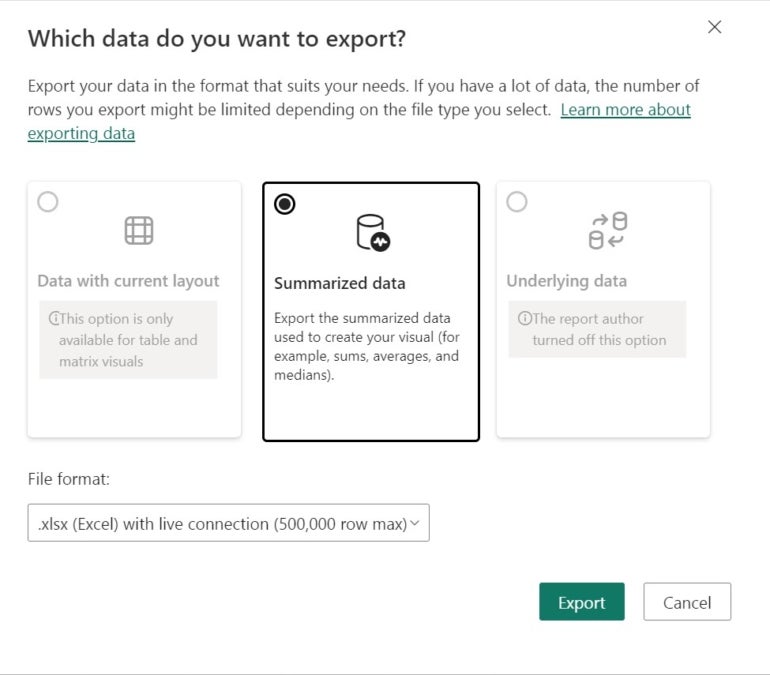
- In the resulting dialog, choose the .xlsx format from the File Format dropdown (Figure F). You can also choose to export a .csv file.
- Notice that Power BI limits this particular export to summarized data. This means you can download the data seen in the visual, but not the complete dataset. If you want the complete dataset, you can stop here and contact the owner. You might also see a sensitivity warning, especially if your organization has rules in place about how to handle sensitive data.
Figure F
- To export, click Export.
- When prompted by your browser, click Open.
The open file will be an Excel .xlsx file. It’s unlikely that the summarized data will be what you’re after at this point. Check Step 4. If you filtered the visualization before exporting, Power BI will export the results of that filter. Return to the report, remove any filter and try again.
If you’re lucky enough to grab all the data, you can use Excel to work with this data as you would any other data.
How to export from a Power BI dashboard
A Power BI dashboard is the final product that the designer wants end users to see. Exporting from a dashboard is similar to the above process for reports, but unless permissions allow for exporting, you won’t get anything.
The ellipsis dropdown will have more options, and the list might limit you to exporting only as a .csv file. If you’re able to download a .csv file, you can open this file in Excel by clicking the Data tab. In the Get & Transform Data group, click Get Data. Then, choose From File and finally From Text/CSV.
Exporting a Power BI dataset
Whether you can download the entire dataset from a report or dashboard depends on your relationship to the data. If you’re the owner and you have Power BI Desktop, your export task is simple. If you are a consumer and the designer didn’t set export permissions for the dataset, you must contact the designer to get the dataset.
If you’re struggling with Microsoft Power BI, explore our list of the best business intelligence tools to see which software may be a better fit for your business.

Subscribe to the Microsoft Weekly Newsletter
Be your company's Microsoft insider by reading these Windows and Office tips, tricks, and cheat sheets.
Delivered Mondays and Wednesdays