
Looker and Tableau are both robust business intelligence tools. But which should you choose for your organization? Each solution will import data from multiple sources, provide in-depth BI analysis and produce rich data visualizations. However, Looker can provide more and ease-of-use functionality, whereas Tableau digs a little deeper into large and complex data sets.
The two products are highly rated BI software, frequently praised for their security, technical support and agility. Let’s compare Looker and Tableau to determine which would be best for your organization.
Jump to:
- Looker vs. Tableau: Comparison table
- Looker and Tableau pricing
- Feature comparison: Looker vs. Tableau
- Looker pros and cons
- Tableau pros and cons
- Review methodology
- Should your organization use Looker or Tableau?
What is Looker?
Looker is a popular, easy-to-use BI analytics dashboard. Employees can create and share views to dig deeper into the performance of their organization. Looker is owned by Google and is offered at a monthly flat rate per company.
What is Tableau?
Tableau is a data visualization suite primarily used for business intelligence and analytics. Through Tableau, organizations can customize and optimize how they interact with their data. Tableau is currently owned by Salesforce and is offered as a monthly per-user subscription.
Looker vs. Tableau: Comparison table
| Features | Looker | Tableau |
|---|---|---|
| Starting price | $5,000 per month | $15 per user per month, billed annually |
| 24/7 phone support | No | Yes |
| Proprietary language | Yes | No |
| Analytics dashboards | Yes | Yes |
| Data refresh | Every hour | Scheduled |
| Infrastructure | Cloud | Desktop and cloud |
| Modifications | Modeling language | Guided story |
Featured partners
Looker and Tableau pricing
Starting at $5,000 per month, Looker can be substantially more costly for smaller companies. As such, Looker is ideal for larger companies that want to remain scalable. By comparison, Tableau’s Creator solution starts at $70 per user, making it ideal for smaller businesses.
Looker pricing
Looker pricing is determined by two main factors: the platform pricing cost to run a Looker instance and the user pricing cost for licensing individual users to access the Looker platform.
Looker offers three platform editions:
- Standard: Pay-as-you-go priced monthly at $5,000, or priced annually for a custom quote price.
- Enterprise: Custom quotes.
- Embed platform: Custom quotes.
User license pricing is consistent across each edition.
- Viewer User: $30 per user per month.
- Standard User: $60 per user per month.
- Developer User: $125 per user per month.
Tableau pricing
Tableau’s Creator edition enables users to govern their solution, interact with the software, collaborate through the system and author works based on their datasets. In addition, Tableau offers its Explorer and Virtual editions with limited capabilities.
- Tableau Creator: $70 per user per month, billed annually.
- Tableau Explorer: $42 per user per month, billed annually.
- Tableau Viewer: $15 per user per month, billed annually.
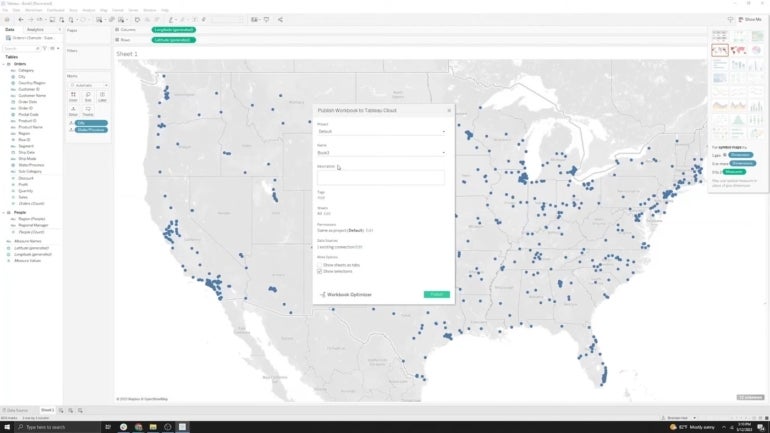
Figure A
Feature comparison: Looker vs. Tableau
Looker vs. Tableau: Main features
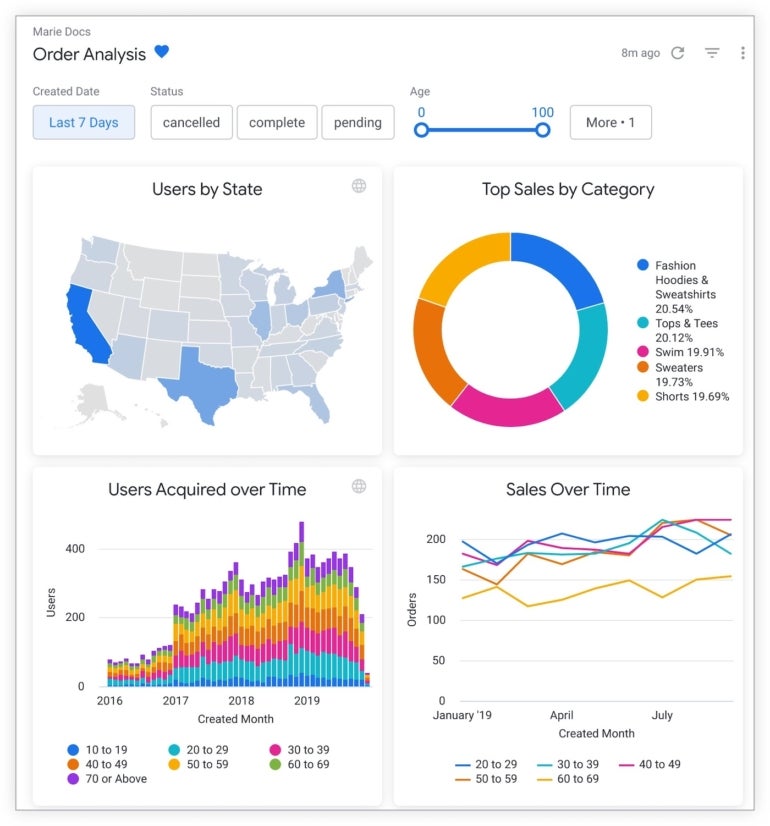
Tableau imports structured and unstructured data to build elegant, human-readable visualizations. Looker likewise provides creatable dashboards with rich visualizations for imported data, which users then customize to suit their needs.
Figure B
Both are full-featured BI tools that include these features:
- Mobile support.
- Interactive visuals.
- Analytics dashboards.
- Governance and metadata management.
- Integrated APIs and tools.
Tableau provides advanced data analysis and visualization, but Looker leaves its options exposed and accessible.
Looker vs. Tableau: Performance
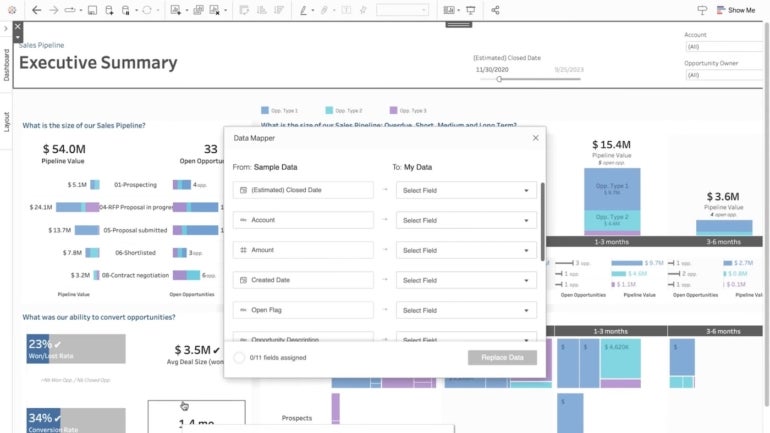
Modern companies are crunching increasingly large data sets. How do Looker and Tableau perform when given big data? In most circumstances, they will work with relatively equal effectiveness. Tableau is more effective with extensive data sets, while Looker is more effective than Tableau in a cloud-native environment.
Figure C
Looker vs. Tableau: Analytics
Looker provides prebuilt, configurable code blocks. LookML, a proprietary SQL-like language, can be used to further interact with and analyze data. Tableau’s analytics solutions don’t have this additional abstraction layer, making it more complicated to use but ultimately more configurable.
Looker vs. Tableau: Support
Looker and Tableau both have reliable service and support solutions. Looker leans heavily on online help centers and in-app chats. Tableau provides support through traditional venues, such as a weekday phone line and 24/7 emergency phone support. Both Looker and Tableau have active and vibrant communities and documentation.
Looker pros and cons
Pros of Looker
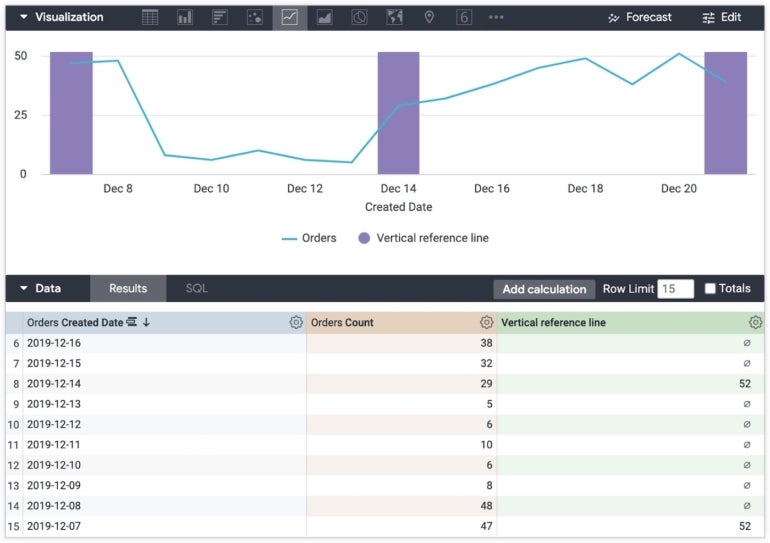
- With Looker’s unified semantic layer, data professionals can simplify complex data for end users by encoding business logic and metrics within centralized data models.
- Looker’s data model ensures a consistent and regulated real-time view of data across multiple clouds, benefiting the entire organization.
- Organizations can enhance their business decisions by embedding proactive insights directly into their business applications using Looker.
- By automating tasks like data preparation and reporting, Looker streamlines data analysis, leading to time and resource savings and more precise results.
- Looker guarantees enterprise-level security through features like role-based access control, data encryption and audit logging. This ensures data security and compliance with security policies.
Figure D
Cons of Looker
- Businesses that rely on a large number of data sources may encounter limitations with the software as it can only connect to a restricted set of data sources.
- Looker’s analytics are not as deep or configurable in comparison to Tableau’s.
Tableau pros and cons
Pros of Tableau
- Users can expedite the discovery of insights with the assistance of AI-powered analytics.
- Machine learning, statistics, natural language processing and intelligent data preparation are readily accessible.
- Einstein Discovery enables users to make smarter decisions by providing predictions and recommendations within workflows. It enables the creation of predictive models without the need for algorithmic coding.
Cons of Tableau
- Users may experience delays when processing large amounts of data within the system.
- Non-technical users may find it challenging to figure out how to use Tableau’s software as it has a significant learning curve.
Review methodology
This is a technical review using compiled literature researched from relevant databases. The information provided within this article is gathered from vendor websites or based on an aggregate of user feedback to ensure a high-quality review.
Should your organization use Looker or Tableau?
Neither solution is necessarily better, but Tableau is more complex than Looker. Looker provides extensive user-friendly features, such as Looker Blocks, which make it easier to manage analytics views. However, Tableau offers more opportunities for advanced data analytics and management.
A few critical factors will go into deciding whether you want to use Looker or Tableau as your organization’s go-to BI software.
- Ease of use: Are your users deep into analytics (Tableau), or will they need an accessible, easy-to-use system (Looker)?
- Cost: Is your company looking for an affordable solution for a handful of employees (Tableau) or a product that can support a large enterprise at a flat rate (Looker)?
- Capabilities: Do you need to dig deeply into your data (Tableau), or are you more concerned about visualizing and using your data (Looker)?
If your organization wants a fast, easy-to-use system with beautiful data visualizations, Looker is the best option. If your organization is looking for deep data analytics or a cost-effective plan for a small number of people, Tableau is the better BI software.
Featured partners
1 Domo

Domo puts data to work for everyone so they can multiply their impact on the business. Underpinned by a secure data foundation, our cloud-native data experience platform makes data visible and actionable with user-friendly dashboards and apps. Domo helps companies optimize critical business processes at scale and in record time to spark bold curiosity that powers exponential business results.

Subscribe to the Data Insider Newsletter
Learn the latest news and best practices about data science, big data analytics, artificial intelligence, data security, and more.
Delivered Mondays and Thursdays